4 minutes ago
2 min read

Summary
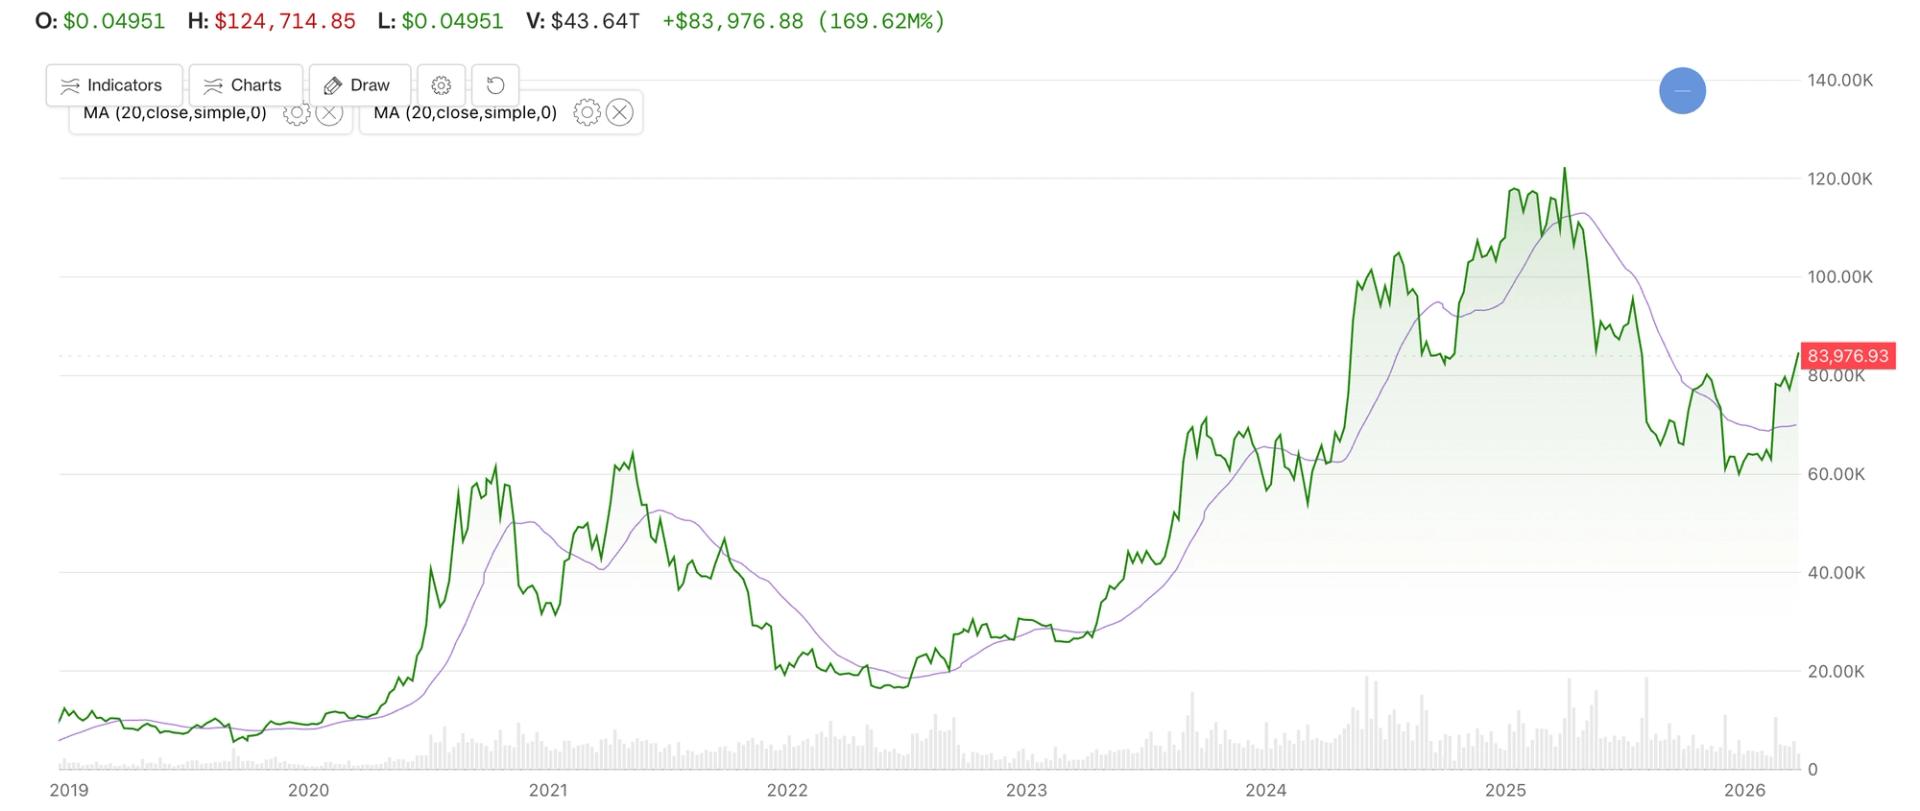
- Bitcoin recently reclaimed its 365-day moving average after 310 days below it, a signal that preceded 12-month gains in five comparable instances but has also produced failed breakouts under broader criteria.
- Analysts at Altcoin Pro remain bullish as long as bitcoin holds above its 200-day moving average, though they cautioned that moving-average signals do not guarantee future gains.
Bitcoin’s BTC$84,326.75
That signal is the price topping its 365-day rolling simple moving average.
On Sept. 22, bitcoin rose above its 365-day average near $80,900 for the first time in 310 days, Ryan Horst and Joni Zhuleku, founders of Altcoin Pro, said in an email conversation.
Altcoin Pro found that bitcoin was higher 12 months later in each of the five previous instances in which it regained its 365-day average after spending at least 90 days below it. The gains ranged from about 59% to more than 1,400%, though the largest increase came in 2012, when bitcoin was a fringe asset.
Horst said the pattern is not fail-safe. When the firm included shorter periods below the line, it found two failed breakouts, in July 2018 and March 2022, when bitcoin fell about 27% and 59%, respectively, within 90 days.
“This September’s move is encouraging, especially after 310 days below the line, but we want to see it hold,” Horst said. “It is a signal, not a guarantee.”
The two remain bullish on bitcoin over the longer term. However, their view depends more on prices trading above the 200-day average than the 365-day average.
“The 365-day is still catching up to something the 200-day already told us in mid-August,” they said. The 200-day average had risen to about $70,800 in AltcoinPro’s calculations, with bitcoin roughly 19% above it before the modest dip of the past 36 hours. The 365-day average, by contrast, was still falling and sat much closer to the market price.
Moving averages are based on past prices, so they show how an asset has traded over a set period rather than where it will go next. A 365-day average responds more slowly to recent changes than a 200-day average.
“The 365-day average is telling you where bitcoin was six months ago,” Ryan and Joni Zhuleku said. “The 200-day reaction is roughly three months earlier. In a market that moves the way this one does, three months is the whole trade.”
Bitcoin’s 50-day average crossed above its 200-day average on Sept. 8, creating the so-called golden cross. This signal has a mixed record as a standalone predictor, with several past crosses failing to produce a sustained rally, CoinDesk’s Omkar Godbole wrote.
AltcoinPro argued this golden cross looks more constructive because it follows a long period below the 200-day average, rather than appearing near a market peak. Bitcoin had spent 293 days below that measure before moving back above it, the founders said, adding that it was shorter than the roughly 436 days it spent below the line during the 2022-23 bear market.
The next test is whether the small selloff pushes bitcoin back toward that level, said Horst and Zhuleku.
Related Assets
- 1
- 2
- 3
- 4
- 5
- 6
- 7
- 8
- 9
- 10
The Definitive Stablecoin Landscape Series: Asia Pacific

The Definitive Stablecoin Landscape Series: Asia Pacific
As stablecoins move into regulated finance, APAC is becoming a key proving ground. This report maps the region’s rules, use cases, and RLUSD’s role.
Sep 15, 2026
As stablecoins move into regulated finance, APAC is becoming a key proving ground. This report maps the region’s rules, use cases, and RLUSD’s role.
Why it matters:
As stablecoins move into regulated finance, APAC is becoming a key proving ground. This report maps the region’s rules, use cases, and RLUSD’s role.